Distance Education Data Insights
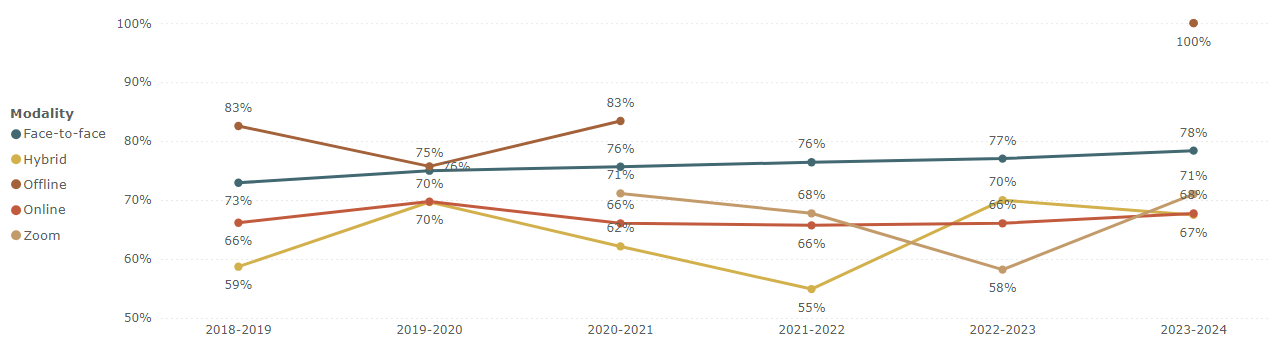
This page provides key insights into student success rates across different instructional modalities over the past several years. Below, you'll find a Disaggregated Enrollment Table, which presents success rate percentages by course modality, including Face-to-Face, Hybrid, Offline, Online, and Zoom-based courses.
These data points help us track trends in student performance and inform strategies for enhancing online and hybrid learning experiences.
Institutional Research Data
Disaggregated Enrollment
Filtered by Course Disaggregation (is Modality), Course Metrics (is Success Rate %)
| Modality | 2018-2019 | 2019-2020 | 2020-2021 | 2021-2022 | 2022-2023 | 2023-2024 |
|---|---|---|---|---|---|---|
| Face-to-Face | 73% | 75% | 76% | 76% | 77% | 78% |
| Hybrid | 59% | 70% | 62% | 55% | 70% | 67% |
| Offline | 83% | 76% | 83% | 100% | ||
| Online | 66% | 70% | 66% | 66% | 66% | 68% |
| Zoom | 71% | 68% | 58% | 71% |